Clinical Vignette
This 65-year-old male presents with lymphocytosis. A peripheral whole blood sample is submitted for flow cytometric immunophenotyping using ClearLLab 10C Panels.
Flow Cytometric Immunophenotyping
B Cell Tube
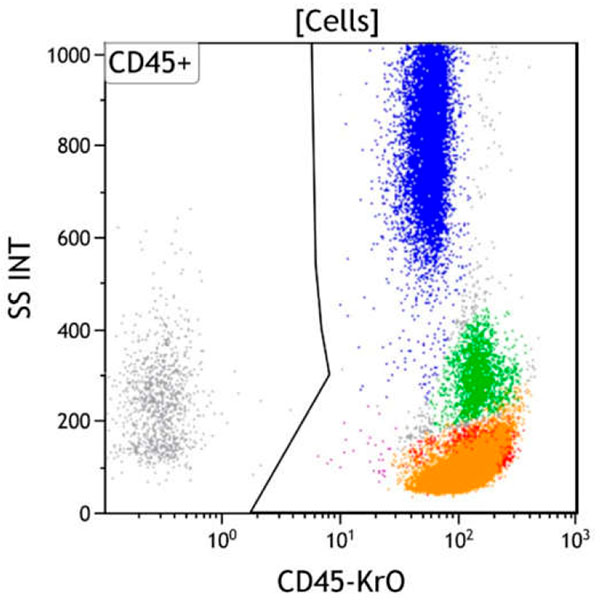
Figure 1. This CD45 vs Side Scatter dot plot shows events in the Cells gate. This plot is intended to highlight various subsets of white blood cells, which are gated as CD45 positive. The CD45 negative population usually includes red blood cells, platelet aggregates, tissue debris or non-hematopoietic cells.
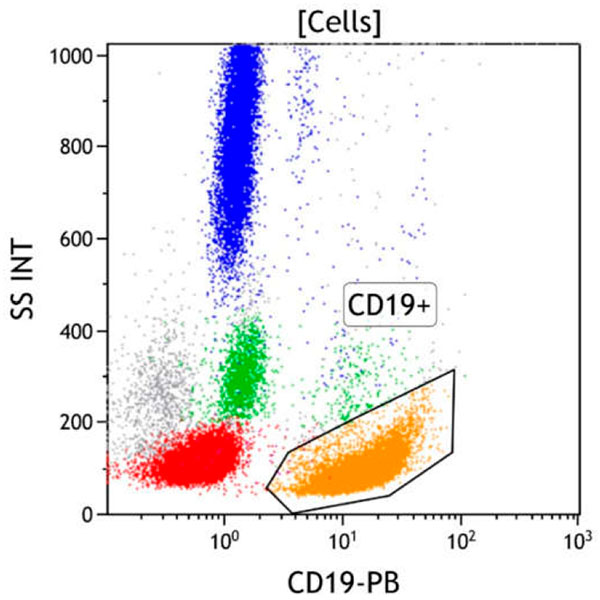
Figure 2. This CD19 vs Side Scatter dot plot shows events in the Cells gate. The CD19+ gate identifies CD19 positive cells. CD19 is expressed on mature and immature B cells, as well as most plasma cells. These cells typically have low to moderate side scatter. Note the relatively increased number of CD19 positive B cells in this sample.
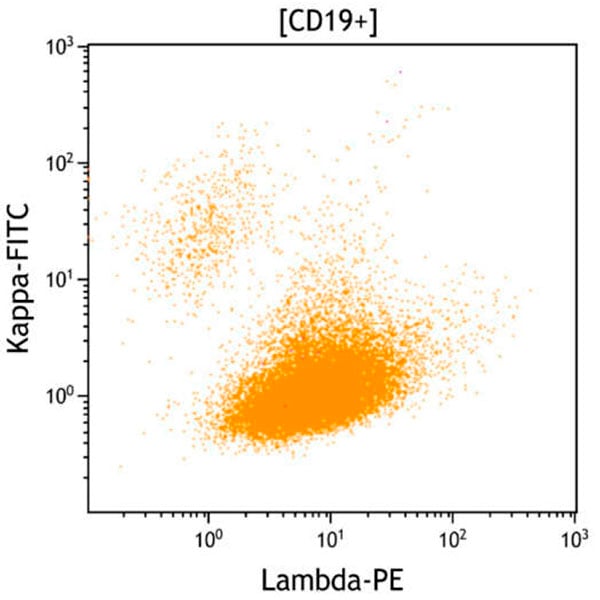
Figure 3. This Lambda vs Kappa dot plot shows all CD19+ cells. Normal mature B cells are polyclonal, expressing either kappa or lambda light chain in a ratio of 1.4 with a range between 1 to 2. The CD19 positive cells (orange) predominantly have surface lambda light chain expression at a decreased level compared with normal mature B cells, indicating a clonal B cell population. A small population of polyclonal B cells (also in orange) with normal levels of kappa and lambda light chain expression is present.
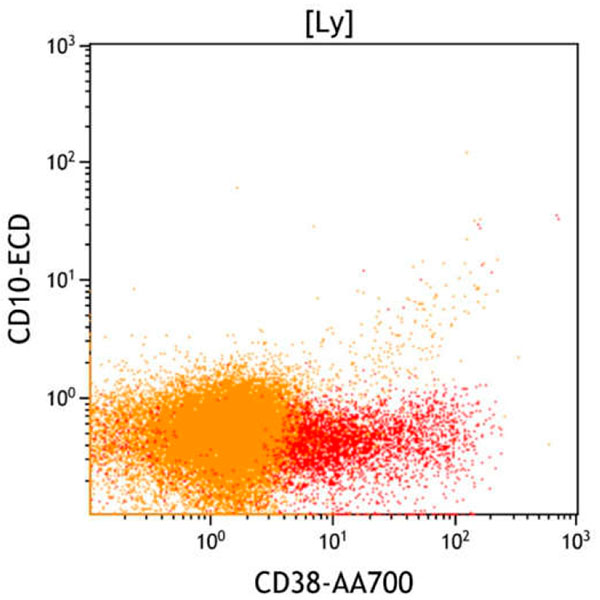
Figure 4. This CD38 vs CD10 dot plot shows all cells in the lymphocyte gate (Ly). CD38 is expressed at the highest level on plasma cells, at a moderate level on immature B cells and at a low level on germinal center B cells. Most mature B cells are low to negative for CD38. T cells (red) show variable CD38 expression dependent on activation state. The clonal B cell population (orange) displays low to absent CD38 expression and is negative for CD10.
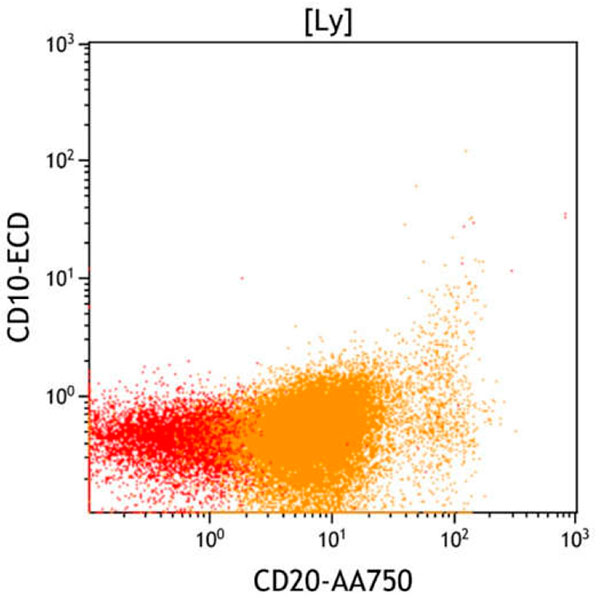
Figure 5. This CD20 vs CD10 dot plot shows all cells in the lymphocyte gate (Ly). Most mature B cells uniformly express high-level CD20. The clonal B cell population (orange) displays decreased CD20 expression and is negative for CD10. The small population with normal CD20 expression (also in orange, lower right) represents normal B cells.
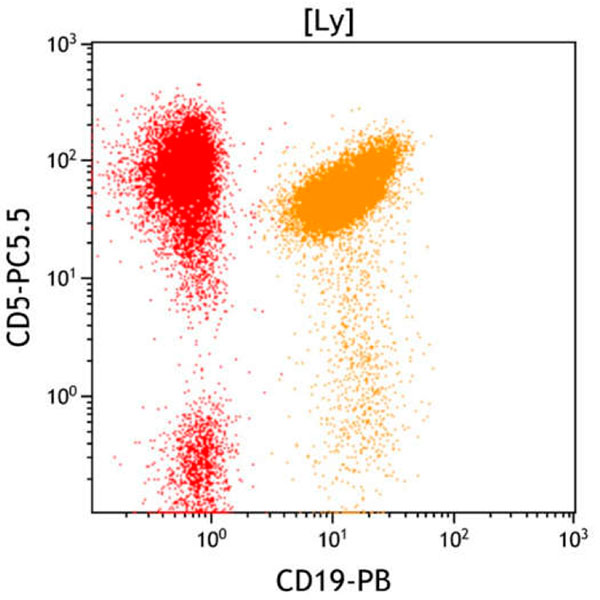
Figure 6. This CD19 vs CD5 dot plot shows all cells in the lymphocyte gate (Ly). CD5 is expressed on T cells (red, upper right), variably expressed at a low level on a subset of normal mature B cells, and expressed on some subtypes of neoplastic B cells. The clonal B cell population (orange) expresses CD5 and CD19. The small population with normal CD19 and low to absent CD5 expression (also in orange, lower right) represents normal B cells.
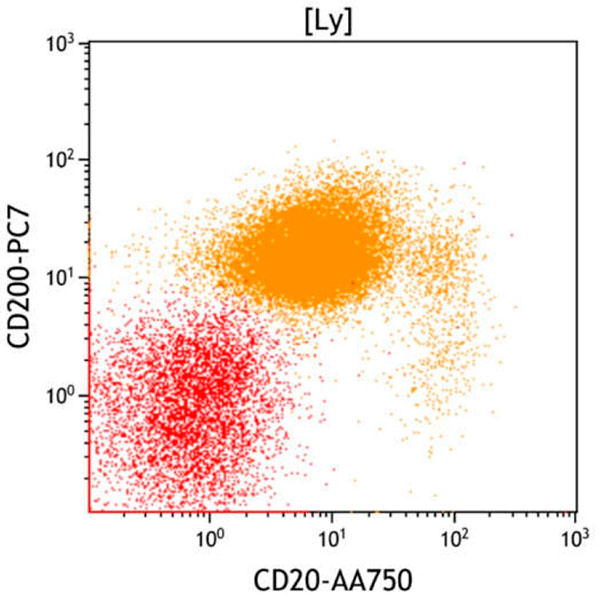
Figure 7. This CD20 vs CD200 dot plot shows all cells in the lymphocyte gate (Ly). Most mature B cells express CD200 at a low to moderate level. The clonal B cell population (orange) is positive for CD200 with decreased CD20. The small population with normal CD20 and CD200 expression (also in orange, right) represents normal B cells.
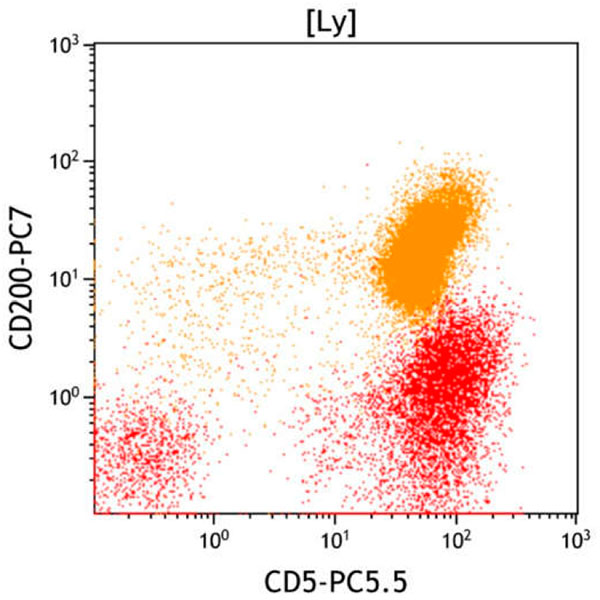
Figure 8. This CD5 vs CD200 dot plot shows all cells in the lymphocyte gate (Ly). Most mature B cells normally express CD200 with a subset variably expressing CD5. Neoplastic B cells in chronic lymphocytic leukemia/small lymphocytic lymphoma typically express CD5 and CD200, whereas mantle cell lymphoma typically expresses CD5 but not CD200. The clonal B cell population (orange) is positive for CD5 and CD200, favoring chronic lymphocytic leukemia/small lymphocytic lymphoma.
To view all flow cytometric dot plots, download the case in PDF format below
Results of Flow Cytometric Immunophenotyping
Flow cytometric immunophenotyping identifies a phenotypically distinct population of cells with expression of intermediate to bright CD5, intermediate CD19, low to intermediate CD20, low to absent CD38, bright CD45, intermediate CD200, and dim surface lambda light chain expression without CD10 or other T or myeloid markers. Compared with normal B cells, the expression of CD5, decreased CD20, and lambda light chain restriction of low intensity are aberrant.
Taken together, the immunophenotype of the aberrant population is most consistent with chronic lymphocytic leukemia/ small lymphocytic lymphoma (CLL/SLL). FISH shows a deletion of chromosome 13q, an abnormality seen in a subset of patients with CLL/SLL. However, a definitive diagnosis of CLL/SLL using current WHO criteria requires the demonstration of disease related clinical and/or laboratory findings and/or the presence of greater than 5,000 neoplastic cells per microliter in the peripheral blood. Therefore, correlation with clinical and laboratory data is recommended, and that additional immunophenotyping may be warranted.