Clinical Vignette
This 70-year-old male presents with circulating blasts. A peripheral whole blood sample is submitted for flow
cytometric immunophenotyping using ClearLLab 10C Panels.
Flow Cytometric Immunophenotyping
B Cell Tube
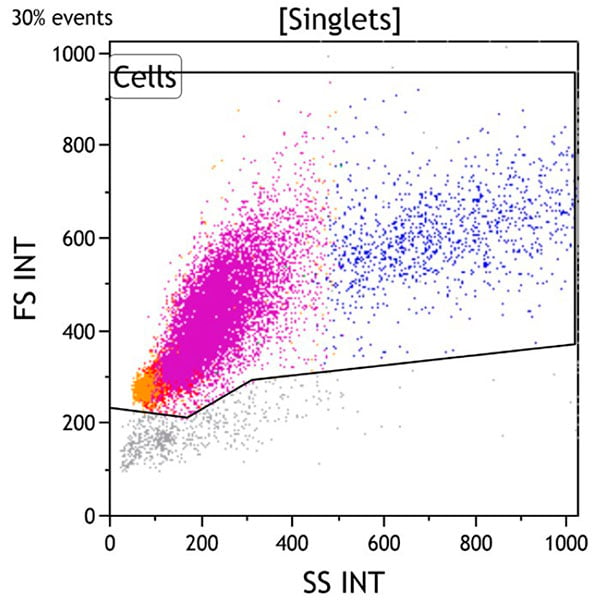
Figure 1. This Side Scatter vs Forward Scatter dot plot shows events in the Singlets gate. This plot is intended to exclude cell debris, which usually has decreased forward scatter. Early apoptotic cells also have mildly increased side scatter while late apoptotic and necrotic cells have variably decreased side scatter. Viable cells are included in the Cells gate.
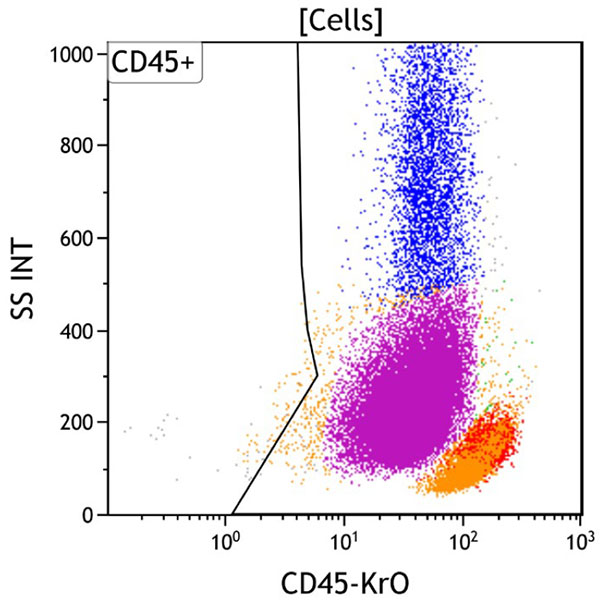
Figure 2. This CD45 vs Side Scatter dot plot shows events in the Cells gate. This plot is intended to highlight various subsets of white blood cells, which are gated as CD45 positive. The CD45 negative population usually includes red blood cells, platelet aggregates, tissue debris or non-hematopoietic cells.
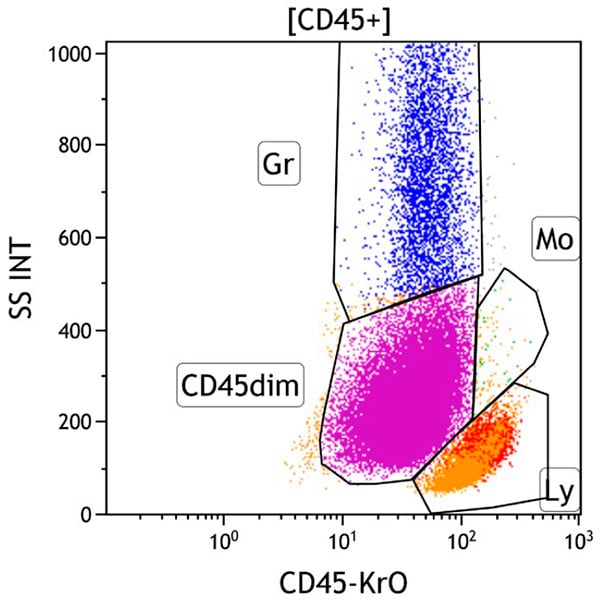
Figure 3. This CD45 vs Side Scatter dot plot shows events in the CD45+ gate. This dot plot permits distinction of several white cell populations typically found in peripheral blood, bone marrow, and lymph node samples, including lymphocytes (Gate Ly, red), monocytes (Gate Mo, green), and granulocytes (Gate Gr, blue). The CD45dim gate (purple) covers the area typically occupied by early progenitors, i.e. myeloblasts and immature B cells. Basophils, plasmacytoid dendritic cells, plasma cells and NK cells may also appear in this area. By applying different colors to the events comprised by each gate, the various populations may be identified throughout the analysis. Note the increased number of progenitors (purple).
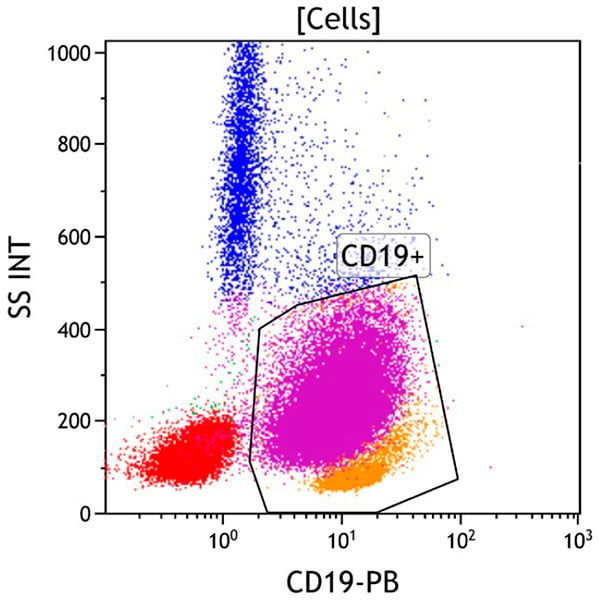
Figure 4. This CD19 vs Side Scatter dot plot shows events in the Cells gate. The CD19+ gate identifies CD19 positive cells. CD19 is expressed on mature and immature B cells, as well as most plasma cells. These cells typically have low to moderate side scatter. The aberrant population (purple) is positive for CD19 and shows variably increased side scatter.
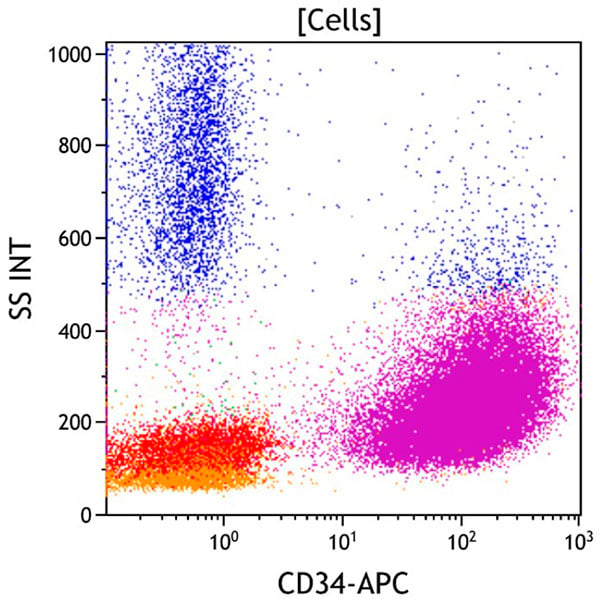
Figure 5. This CD34 vs Side Scatter dot plot shows all viable cells. CD34 is a marker of early hematopoietic progenitors. It is expressed on hematopoietic stem cells, early myeloid progenitors (myeloblasts), and immature B and T cells (lymphoblasts). The aberrant population (purple) is strongly positive for CD34.
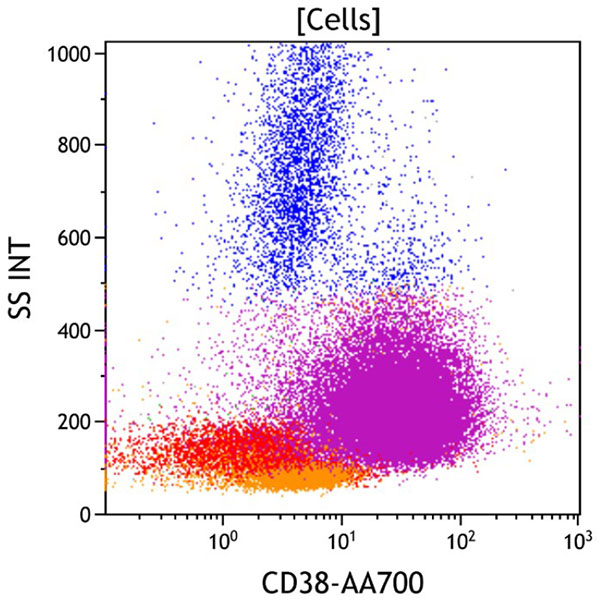
Figure 6. This CD38 vs Side Scatter dot plot shows all viable cells. CD38 is an activation marker. It is expressed at the highest level on plasma cells, at a moderate level on immature myeloid and lymphoid progenitors, at a low level on monocytes, and at a variably low level on activated mature lymphocytes (red). The aberrant population (purple) is positive for CD38.
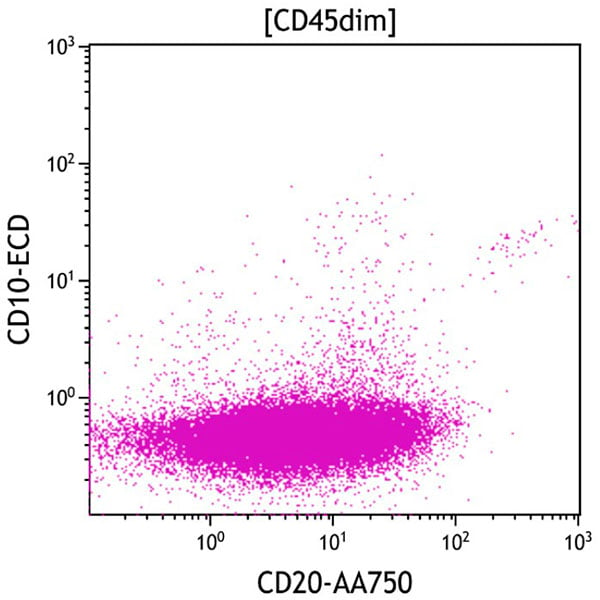
Figure 7. This CD20 vs CD10 dot plot shows all cells in the CD45dim gate. The aberrant population (purple) displays variable CD20 expression and lacks CD10 expression.
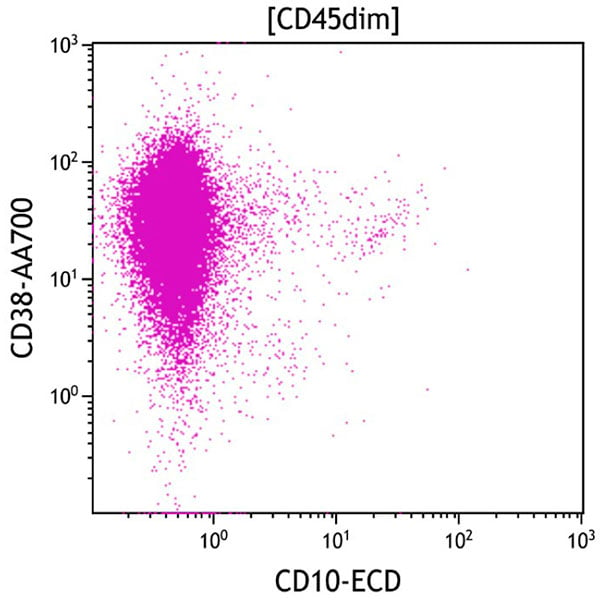
Figure 8. This CD10 vs CD38 dot plot shows all cells in the CD45dim gate. The aberrant population (purple) is positive for CD38 and negative for CD10.
To view all flow cytometric dot plots, download the case in PDF format below
Results of Flow Cytometric Immunophenotyping
Flow cytometric immunophenotyping identifies a phenotypically distinct population of cells with expression of dim
CD13, intermediate CD19, variable CD20, bright CD34, intermediate CD38, dim CD45, low to intermediate CD123, and
intermediate HLA-DR without
CD10, CD33, CD117, or other B, T, or myeloid markers. Compared with normal B cell precursors, the increase in side
scatter, absence of CD10, dim CD13, increased CD34, slight and variable decrease in CD38, and presence of CD123 are
aberrant. Morphology
shows 95% blasts, which in combination with the immunophenotypic findings is indicative of a B lymphoblastic
leukemia/lymphoma.
Taken together, the findings in this case are most consistent with B lymphoblastic leukemia/lymphoma. Note that
correlation with clinical and laboratory data is recommended, and that additional immunophenotyping may be
warranted.