Clinical Vignette
This 20-year-old male presents with tissue mass. A lymph node biopsy sample is submitted for flow cytometric immunophenotyping using ClearLLab 10C Panels.
Flow Cytometric Immunophenotyping
T Cell Tube
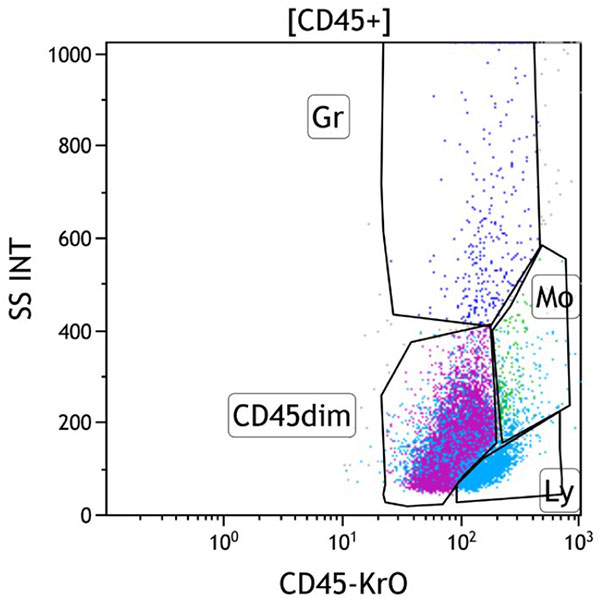
Figure 1. This CD45 vs Side Scatter dot plot shows events in the CD45+ gate. This dot plot permits distinction of several white cell populations typically found in peripheral blood, bone marrow, and lymph node samples, including lymphocytes (Gate Ly, aqua/red), monocytes (Gate Mo, green), and granulocytes (Gate Gr, blue). The CD45 dim gate covers the area typically occupied by myeloblasts and immature B cells. Basophils, plasmacytoid dendritic cells, plasma cells and NK cells may also fall in this area. By applying different colors to the events comprised by each gate, the various populations may be followed throughout the analysis. The progenitor population (purple) is expanded.
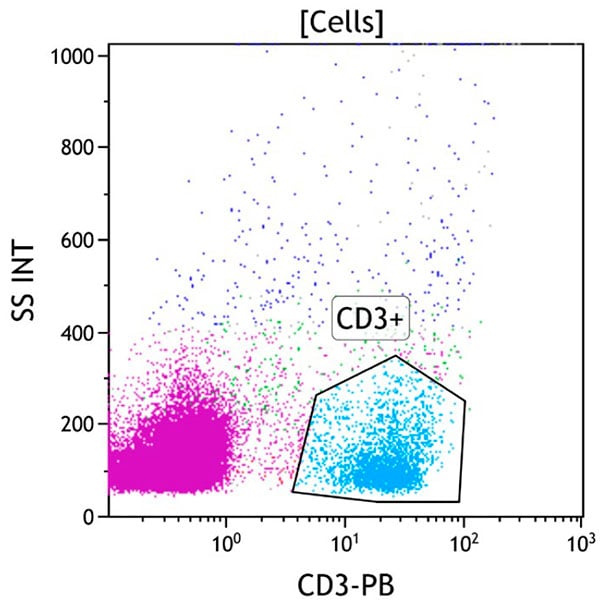
Figure 2. This CD3 vs Side Scatter dot plot shows all viable cells. The CD3+ gate identifies cells with surface CD3 expression (aqua). CD3 is highly specific for T cells, being expressed only on the surface of mature T cells and later stage immature T cells. These cells typically have low to moderate side scatter. Progenitors (purple) do not express surface CD3.
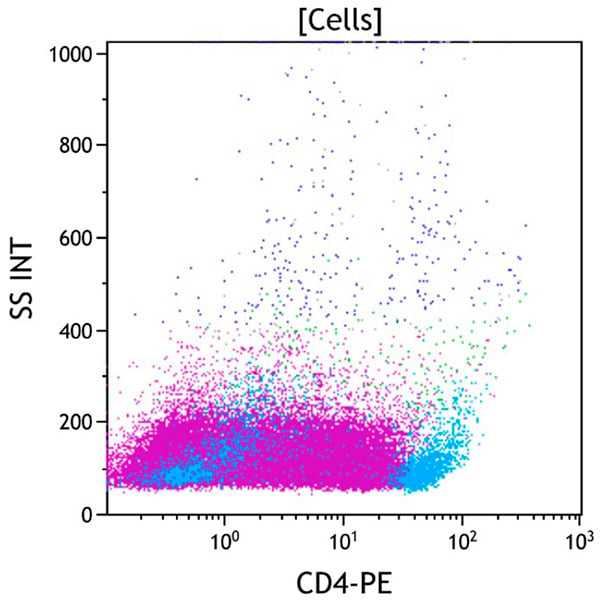
Figure 3. This CD4 vs Side Scatter dot plot shows all viable cells. CD4 is expressed on a subset of immature and mature T cells at a high level (aqua). CD4 is also expressed on monocytic cells (green) at a level lower than that of CD4 positive T cells. It is also expressed at a low level on immature progenitors of multiple lineages in bone marrow. Progenitors (purple) variably express CD4.
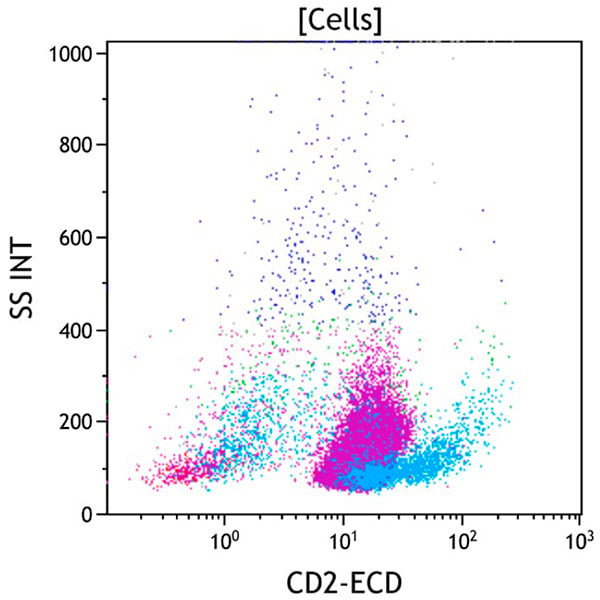
Figure 4. This CD2 vs Side Scatter dot plot shows all viable cells. CD2 is an antigen expressed by nearly all immature and mature T cells (aqua). CD2 is also expressed on NK cells (red) and at a low level on monocytes (green). Progenitors (purple) do express intermediate CD2.
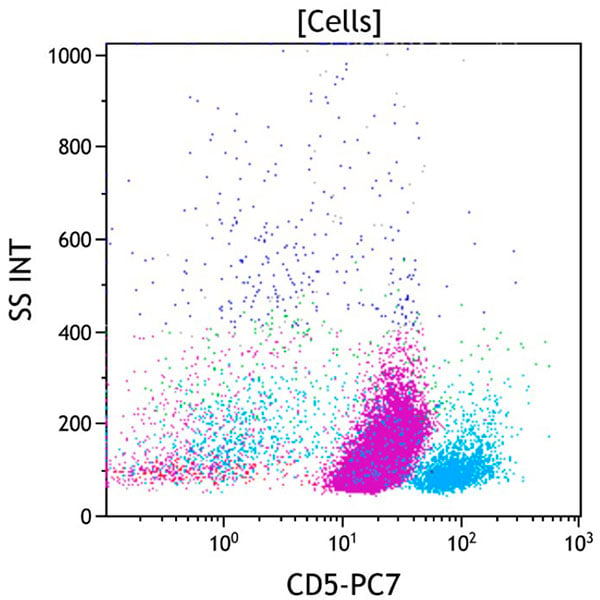
Figure 5. This CD5 vs Side Scatter dot plot shows all viable cells. CD5 is expressed on most immature and mature T cells (aqua), and at a low level on a subset of mature B cells. Very early immature T cells and gamma/delta T cells typically have little to no CD5 expression. A small subset of NK cells expresses CD5. Progenitors (purple) express CD5 at a level lower than mature T cells (aqua).
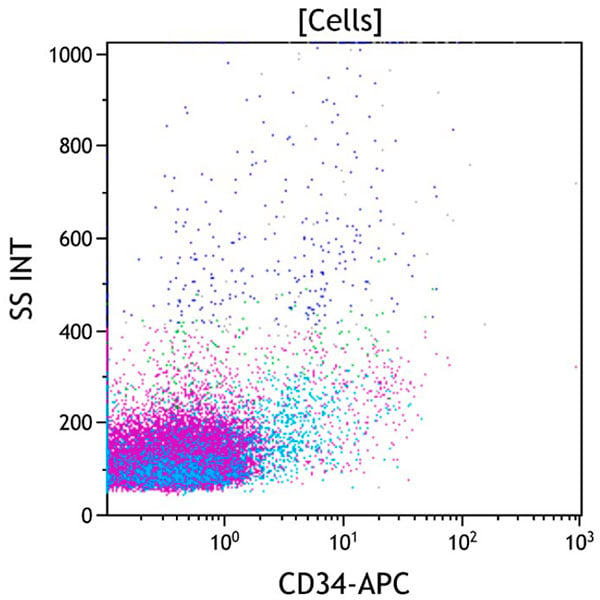
Figure 6. This CD34 vs Side Scatter dot plot shows all viable cells. CD34 is a marker of early hematopoietic progenitors. It is expressed on hematopoietic stem cells, early myeloid progenitors (myeloblasts), and immature B and T cells (lymphoblasts). CD34 positive progenitors typically have low to intermediate side scatter in the CD45 dim gate with immature B cell progenitors having lower side scatter than immature myeloid progenitors. Progenitors (purple) do not express CD34.
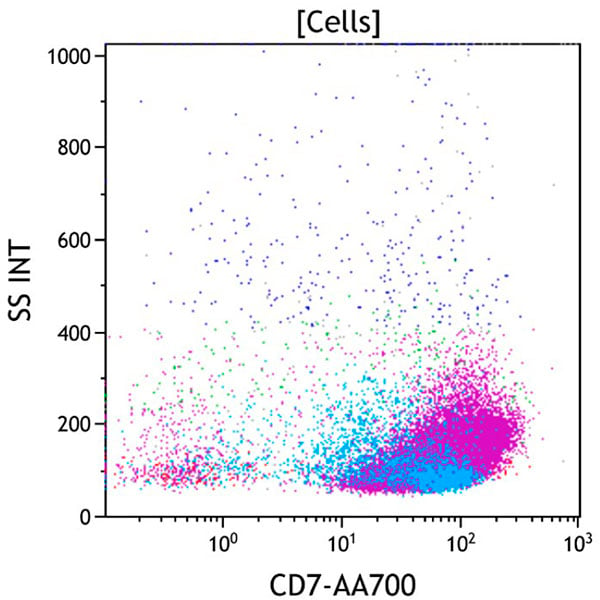
Figure 7. This CD7 vs Side Scatter dot plot shows all viable cells. CD7 is expressed on immature T cells at the earliest stage of T cell development and persists throughout T cell maturation to be variably expressed on mature T cells (aqua). It is also uniformly expressed on NK cells (red, lower right), and dimly expressed on a subset of plasmacytoid dendritic cells and a subset of the lineage committed CD34 positive progenitors. Progenitors (purple) express bright CD7.
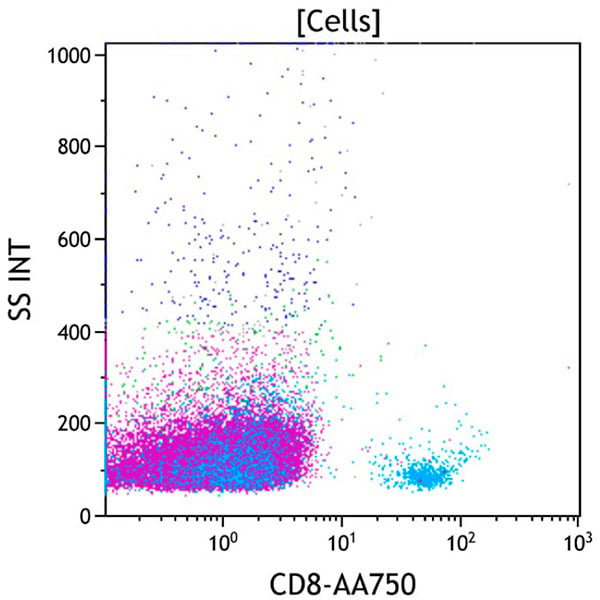
Figure 8. This CD8 vs Side Scatter dot plot shows all viable cells. CD8 is expressed on a subset of immature and mature T cells (aqua) and defines the cytotoxic mature T cell population. It is variably expressed at a low level on NK cells and gamma-delta T cells. Progenitors (purple) do not express CD8.
To view all flow cytometric dot plots, download the case in PDF format below
Results of Flow Cytometric Immunophenotyping
Flow cytometric immunophenotyping identifies a phenotypically distinct population of cells with expression of intermediate CD2, variable CD4, intermediate CD5, bright CD7, dim CD10, bright CD38, intermediate CD45 and are negative for surface CD3, CD8, CD19, CD34, CD56, CD117 and other B cell or myeloid antigens. Compared with normal immature T cells, the expression of CD4 and CD10 without CD8 and the bright CD38 is abnormal.
The immunophenotype of the abnormal population is in keeping with abnormal immature T cells, i.e. T-lymphoblasts. The findings are consistent with a diagnosis of T–lymphoblastic leukemia/lymphoma. Additional testing for cytoplasmic CD3 and TdT could be performed to confirm T cell lineage and immaturity, respectively.