Clinical Vignette
This 51-year-old male presents with circulating blasts. A bone marrow sample is submitted for flow cytometric immunophenotyping using ClearLLab 10C Panels.
Flow Cytometric Immunophenotyping
M1 Cell Tube
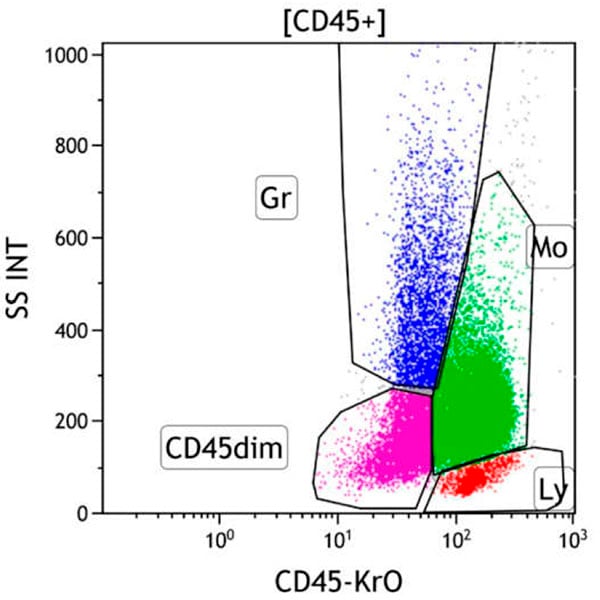
Figure 1. This CD45 vs Side Scatter dot plot shows events in the CD45+ gate. This dot plot permits distinction of several white cell populations typically found in peripheral blood, bone marrow, and lymph node samples, including lymphocytes (Gate Ly, red), monocytes (Gate Mo, green), and granulocytes (Gate Gr, blue). The CD45 dim gate (purple) covers the area typically occupied by myeloblasts and immature B cells. Basophils, plasmacytoid dendritic cells, plasma cells and NK cells may also fall in this area. By applying different colors to the events comprised by each gate, the various populations may be followed throughout the analysis. Note that progenitors (purple) and monocytes (green) are relatively expanded in number.
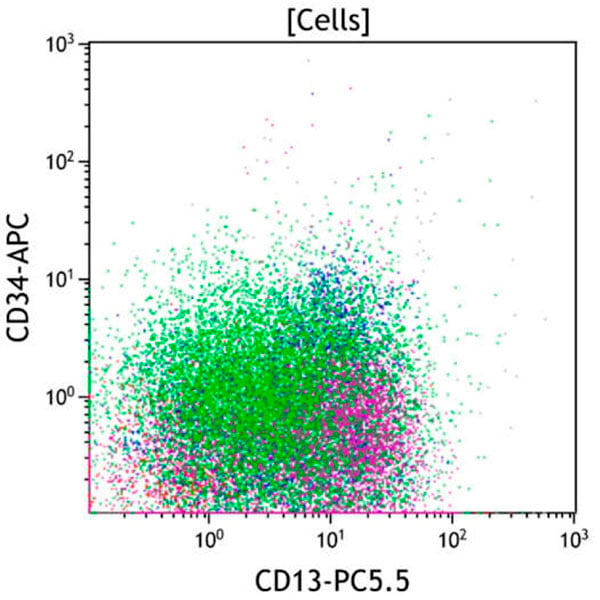
Figure 2. This CD13 vs CD34 dot plot shows all viable cells. CD13 is expressed on maturing granulocytes, monocytes, basophils, and CD34 positive progenitors. CD34 is expressed on early hematopoietic progenitors. CD13 is not well expressed on CD34 positive B cell progenitors or mature lymphoid cells. The progenitors (purple) and monocytes (green) express CD13 without CD34.
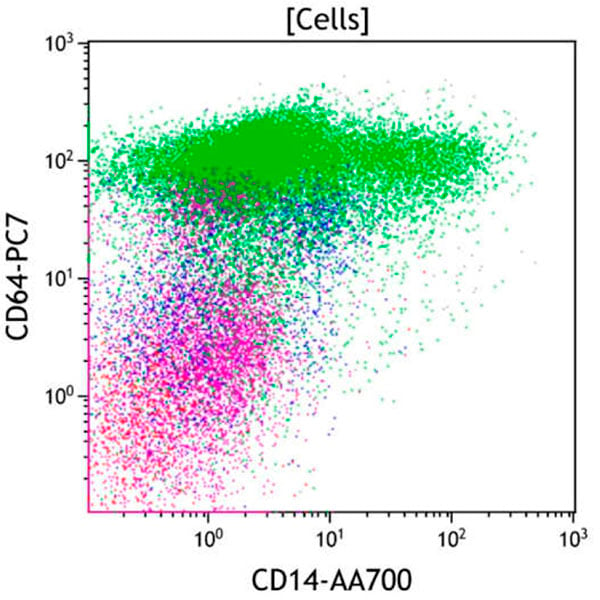
Figure 3. This CD14 vs CD64 dot plot shows all viable cells. CD64 is expressed at a high level on monocytes and at a lower level on maturing granulocytes. CD14 is expressed at a high level on mature monocytes and a lower level on mature granulocytes. Immature monocytes show high expression of CD64 without CD14 and progressively acquire CD14 during maturation to mature monocytes while retaining high-level CD64. Immature granulocytes express moderate CD64 without CD14 and acquire CD14 and lose CD64 at transition to mature granulocytes. The progenitors (purple) do not express CD14 or CD64 but monocytes (green) express bright CD64 with variable CD14 on a small subset.
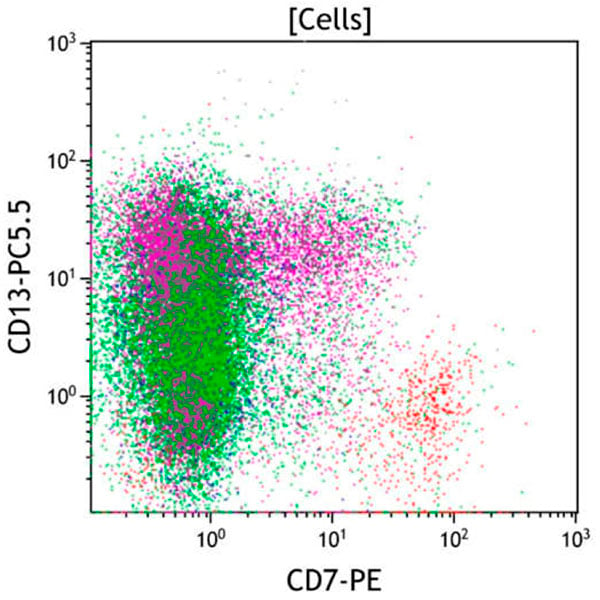
Figure 4. This CD7 vs CD13 dot plot shows all viable cells. CD7 is expressed on T cells and NK cells. CD13 is expressed on maturing granulocytes, monocytes, basophils, and CD34 positive progenitors. Coexpression of CD13 and CD7 is generally not seen. The progenitors (purple) express CD7 on a subset and intermediate CD13 but the monocytes (green) express variable CD13 with minimal CD7.
M2 Cell Tube
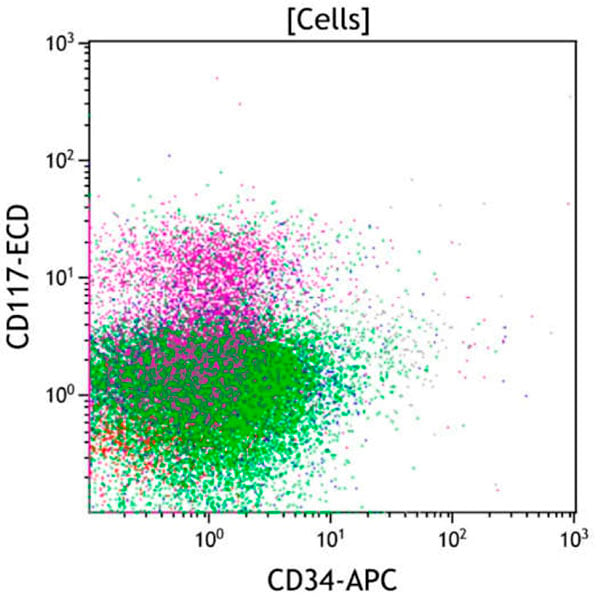
Figure 5. This CD34 vs CD117 dot plot shows all viable cells. CD34 is expressed on myeloid blasts and early immature B cell precursors. CD117 is expressed on myeloid blasts, promyelocytes, and early erythroid precursors, but negative on early B cell precursors. The progenitors (purple) express CD117 without CD34 and monocytes (green) do not express CD34 or CD117.
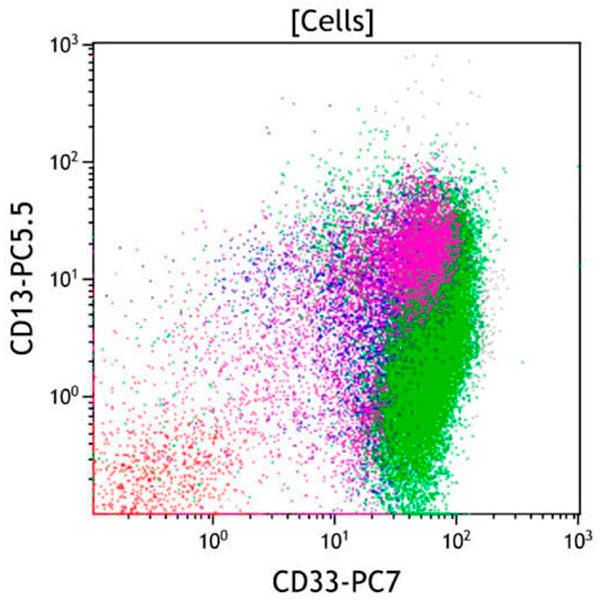
Figure 6. This CD33 vs CD13 dot plot shows all viable cells. CD33 and CD13 are expressed on monocytes, maturing granulocytes, basophils, and CD34 positive progenitors. Monocytes express CD33 at a uniformly high level with more variable CD13. Immature granulocytes express higher CD33 and lower CD13 than more mature granulocytes. Lymphocytes largely do not express either CD13 or CD33 (red). The progenitors (purple) express bright CD33 with intermediate CD13 but monocytes (green) express bright CD33 with dim to intermediate CD13.
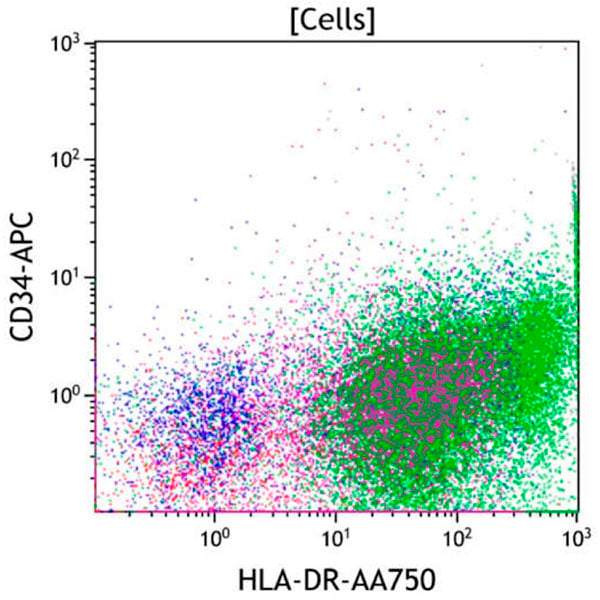
Figure 7. This HLA-DR vs CD34 plot shows all viable cells. HLA-DR is expressed on B cells, monocytes, plasmacytoid dendritic cells, and CD34 positive progenitors. CD34 is expressed on early progenitors. Early progenitors variably express both CD34 and HLA-DR with the highest level of HLA-DR seen on early monocytes. The progenitors (purple) and monocytes (green) express intermediate to bright HLA-DR without CD34.
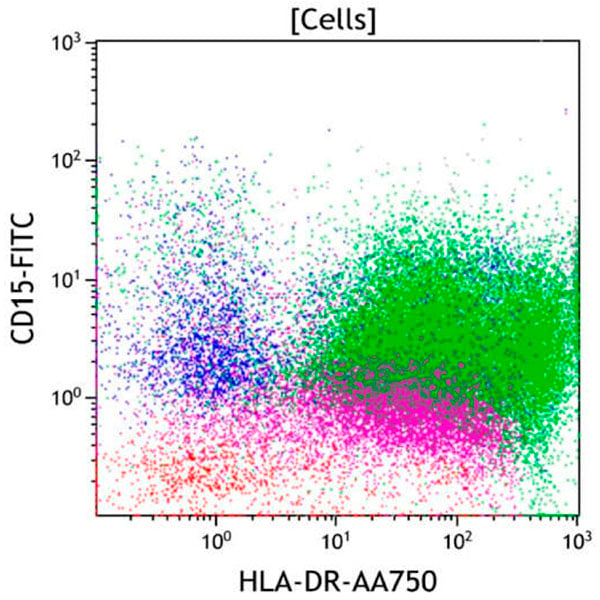
Figure 8. This HLA-DR vs CD15 dot plot shows all viable cells. CD15 is expressed on maturing granulocytes and monocytes. HLA-DR is expressed on B cells, monocytes, plasmacytoid dendritic cells, and CD34 positive progenitors. Maturing granulocytes do not express HLA-DR (blue), except the earliest forms where CD15 is being acquired. CD34 positive myeloid progenitors express HLA-DR but only transiently express CD15. The progenitors (purple) express intermediate to bright HLA-DR without CD15 and monocytes (green) express intermediate to bright HLA-DR with dim CD15.
To view all flow cytometric dot plots, download the case in PDF format below
Results of Flow Cytometric Immunophenotyping
Flow cytometric immunophenotyping identifies two phenotypically distinct populations of cells. The first are progenitors with expression of intermediate CD4, dim variable CD7 on a subset, intermediate CD13, bright CD33, intermediate CD38, dim CD45, low to intermediate CD117, intermediate CD123 and intermediate to bright HLA-DR without CD14, CD15, CD34, CD64 and other lymphoid or myeloid antigens. Compared with normal CD34-positive progenitors, the expression of CD7, increased expression of CD33, and absence of CD34 is aberrant. The second population is monocytes with expression of intermediate CD4, bright CD11b, dim to intermediate CD13, dim to intermediate CD14 on a small subset, dim CD15, bright CD33, intermediate CD38, bright CD64, intermediate CD123 and intermediate to bright HLA-DR without CD34, CD117 and other lymphoid or myeloid antigens. Compared with normal mature monocytes, the decreased expression of CD13 and CD14 is aberrant.
The immunophenotype of the abnormal populations are those of expanded abnormal CD34-positive progenitors and immature monocytic progenitors, respectively, and consistent with acute myeloid leukemia having monocytic differentiation. Additional testing from the subject shows the presence of 96% blasts by morphology and 3-4% positivity by myeloperoxidase. These findings, in combination with the immunophenotyping data, are indicative of an acute monocytic leukemia.